Any manufacturer who wants to get an edge on productivity and cutting costs, and ultimately achieve success, knows how important technology is. Advanced equipment runs on the floor constantly, and innovations continue to propel the industry forward. But what about the technology behind the scenes? Often, the technology that drives strategic decision-making data gets overlooked when it shouldn’t be. This post kicks off a new four-part mini-series on our blog, in which we teach you how to unravel manufacturing forecast solutions and master them for your business. In this first post, we focus on establishing controls for your solution.
Note: This is a multi-user workflow model that contains a mix of higher and lower analytical user levels across departments.
The importance of establishing controls
Having too much information is almost as bad as – if not worse than – not having enough. When you have too much data, key decision makers typically miss the forest for the trees. Solid communication, however, can solve many common manufacturing challenges. The more connected your business is, the easier it is to adapt forecasting solutions as the standards and markets changes.
In our experience, the biggest issues we faced were availability of data, the accuracy of that data, and the way it was communicated. This stemmed from piece-mealed metrics we had to chase down from other departments that we then had to verify. Was it even the correct version of data? To make matters worse, when we received the spread sheets, we encountered overwritten formulas. Now the integrity of the data was in question. All of this resulted in wasted time, something no one can ever afford.
Creating Relationships
Within this example there are four total users: Human Resources, Demand Planning, Plant 1, and Plant 2. By having individual users, security permissions will add protection given the sensitivity of material. All documents are connected via [simple_tooltip content=’This is a specific member within a user’s data model. A common use is the data type – what forecast or budget the user is in (i.e. February Forecast 2020). You can manage these variables from a single location within the Modeler screen. The Modeler will only need to remap a single member for that change to automatically generate everywhere the variable was mapped.’]Process Variables[/simple_tooltip], which allow the user to easily change over data types from month to month.
I chose to start the workflow with an activity called Controls (see Figure 1). This contains three input sheets, two of which nest groupings together using a member within the measure dimension called [simple_tooltip content=’Based off the configuration of the user, product flags are used to create relationships and assignments to limit product items within the scope to eliminate options within the dimension.’]Product Flag[/simple_tooltip]. The purpose here is to pair product flags with task bindings to create exclusivity in the choose prompts.

Establishing Performance Metrics
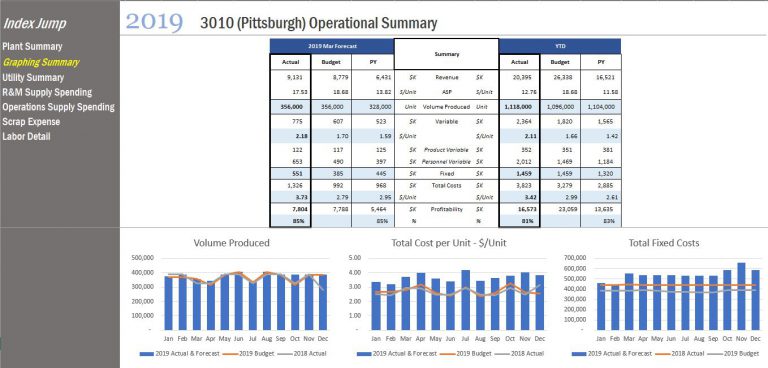
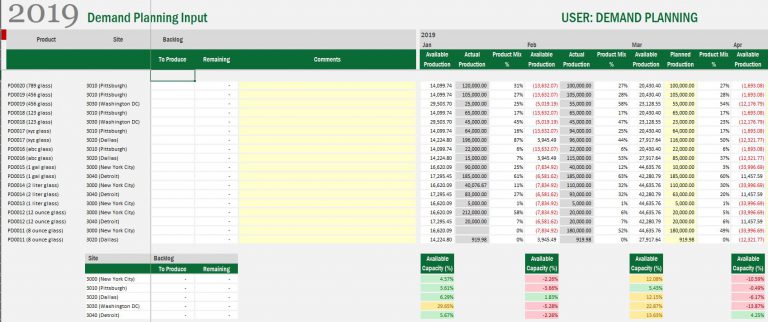
In the manufacturing industry, a crucial step in establishing controls for your forecast solution is setting up key performance metrics. First, we recommend using a Portfolio Management tool to help understand what products are being made, and where. As product lines expand, this portfolio will allow management to take a broad, strategic view of the company’s entire product catalog. With this strategic vantage point, they can now identify market opportunities and better ways to allocate resources.
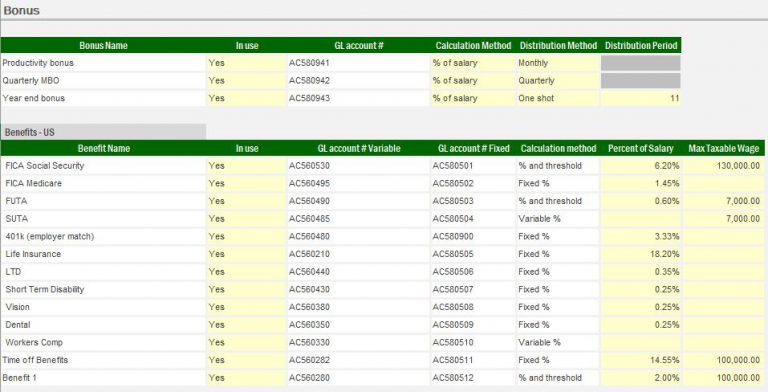
Secondly, you need to define a financial roadmap of the product. This helps you identify the costs for each step, and allows the Accounting department to understand the flow of material and overhead associated with each step of manufacturing process. Additionally, this facilitates communication among Engineering, the Manufacturing Plant, and Accounting. These cost centers that define the roadmap can be at a smaller level than a department. For example, it could involve a particular job position, machine, or assembly line. Moreover, a cost center can have multiple machines with material flowing through it.
Lastly, set up the number of working days in a month as a performance metric. Behind the scenes, this input collects the man-hours per month. This not only allows the user to later leverage the budget/forecast tool, but also allows him to figure out the production availability in the demand planning piece.
Manufacturing forecast solutions can benefit your business.
In summary, setting up controls for your manufacturing forecast solution is important. By setting up the process variables, product flags, and consistent data points, you lay the foundation for Demand Planning, Human Resource Utilization, and other operational reporting.
Read More >> Manufacturing Forecast Solutions: Demand Planning