The definition of a ‘Synthetic Dimension’ is a dimension based on fields that are not stored in your data model. There are many uses of a Synthetic Dimension – For the sake of this post, I am going to cover the most common use that I’ve experienced.
It is all too often when a client says, “It would be really nice to see a percentage of Overtime/Regular mixed in with other aggregations and counts within the same column in a chart or table.” Clients are used to using Excel and manipulating the data exactly how they want. The problem with using Excel is that it is not easily updated each month with new numbers on a large scale with multiple folks. No worries though! In marches QlikView with the power of Synthetic Dimensions! Synthetic dimensions can display KPI’s inter-mixed with aggregations and counts within the same column on a chart. How awesome!
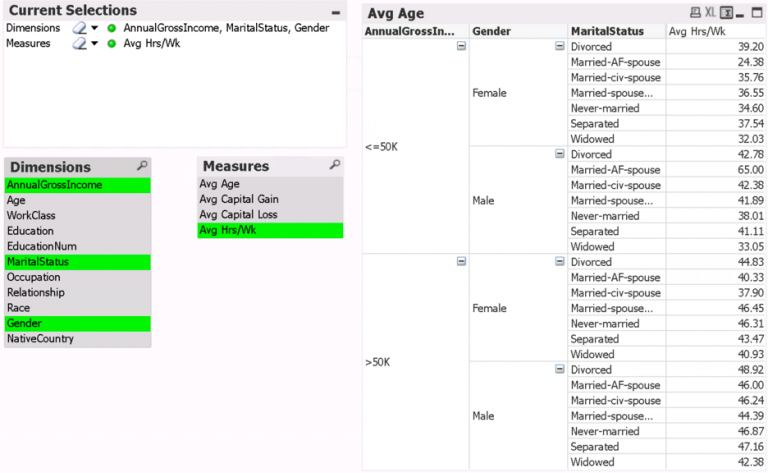
The example below shows Wages and Overtime along with a Variance and a Target Overtime as a percentage of Wages.
Below is the Script used to populate the Dimensions that will be displayed within the final chart:

Below is the Dimensions syntax that is mixed in with the aggregations normally used:

The Chart output will appear as such:

This specific use of a Synthetic Dimension can lend itself to quickly generate charts to spot trends within the given data set.